Start here
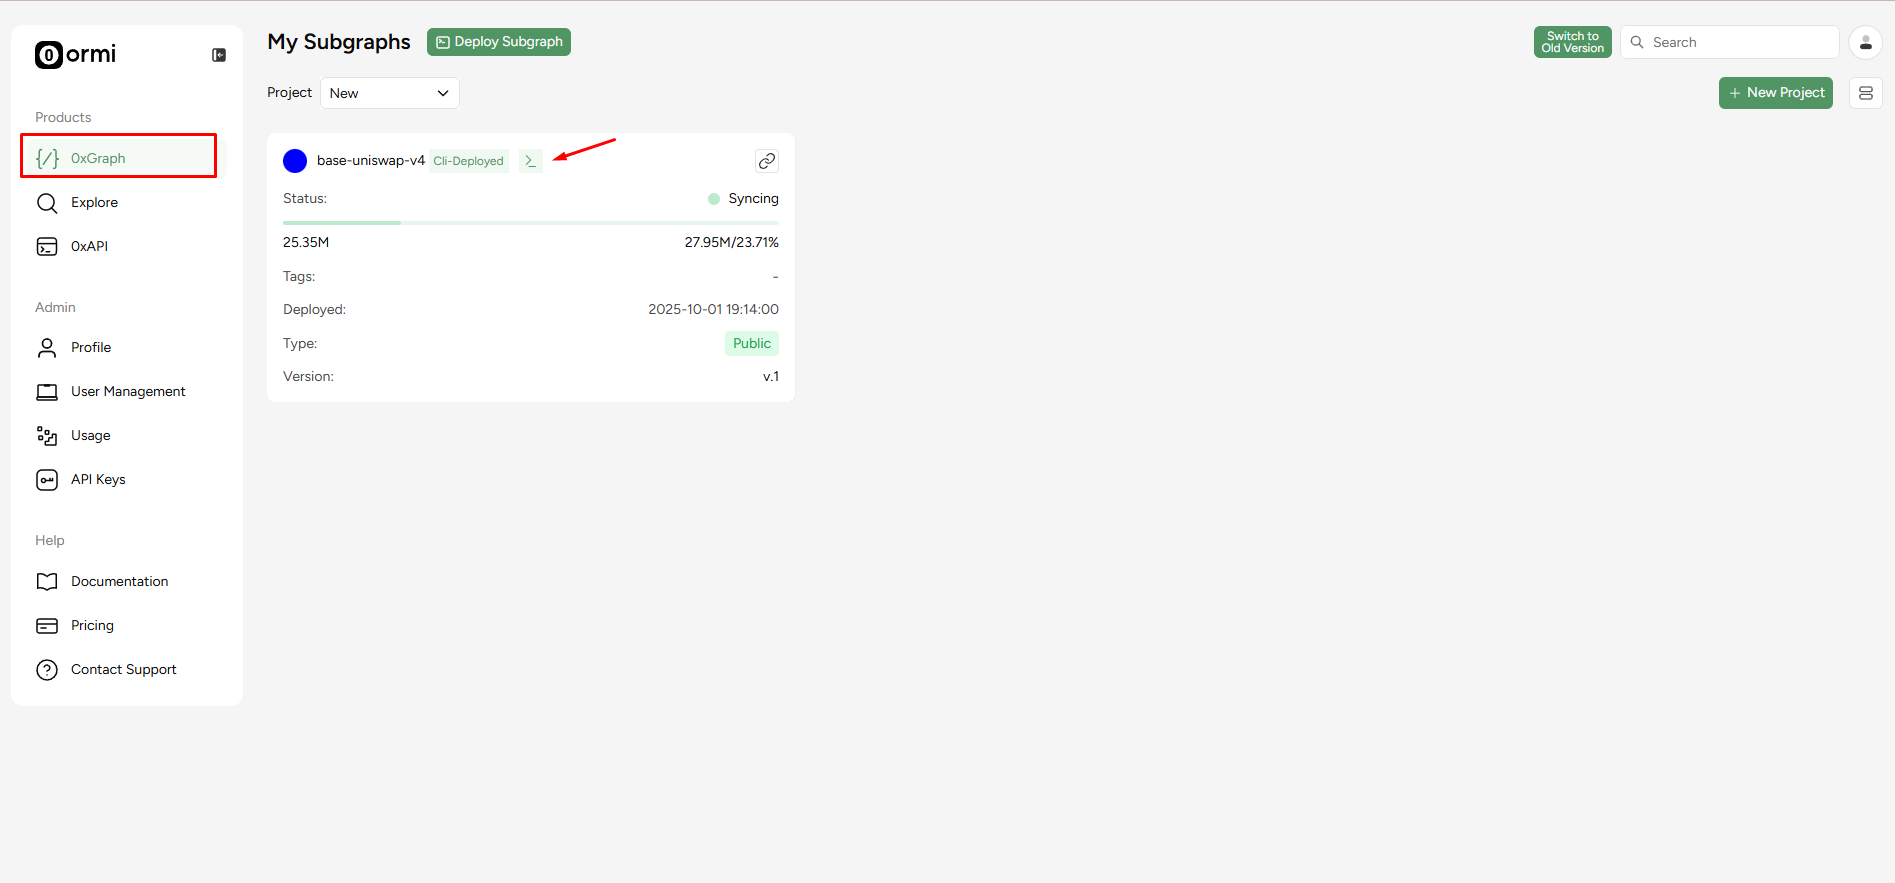
- Go to the Ormi app.
- Select the subgraph you want to monitor.
- Click on the
>_icon of the subgraph card to open the detailed view.
Syncing status
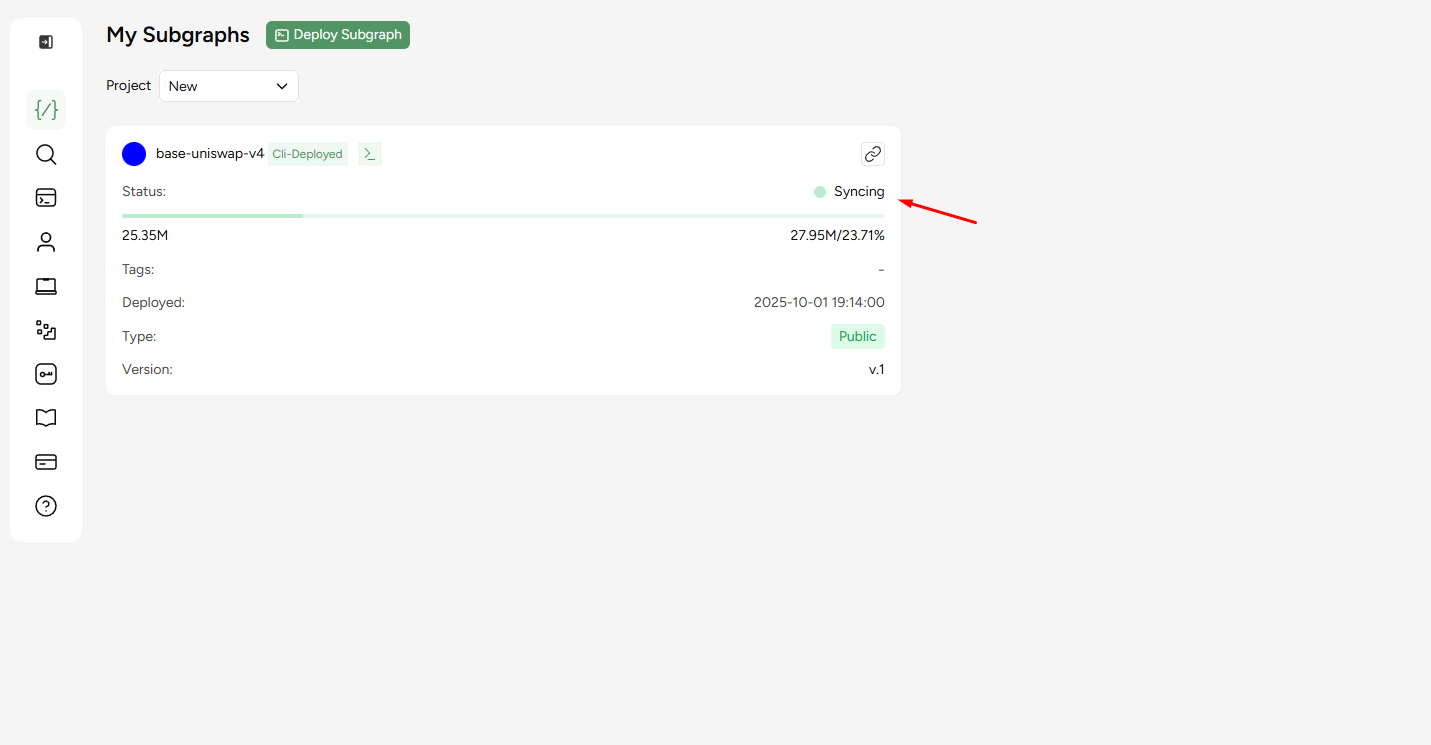
Syncing- The subgraph is currently indexing blocks and catching up to the chain head.Live- The subgraph is fully synced and serving queries in real time.Pause- Indexing is temporarily stopped. Queries may still return existing data. The pause function is a manual toggle and the subgraph owner can pause the subgraph at any time.Error- The subgraph encountered a problem during indexing. Check logs for details.
View analytics
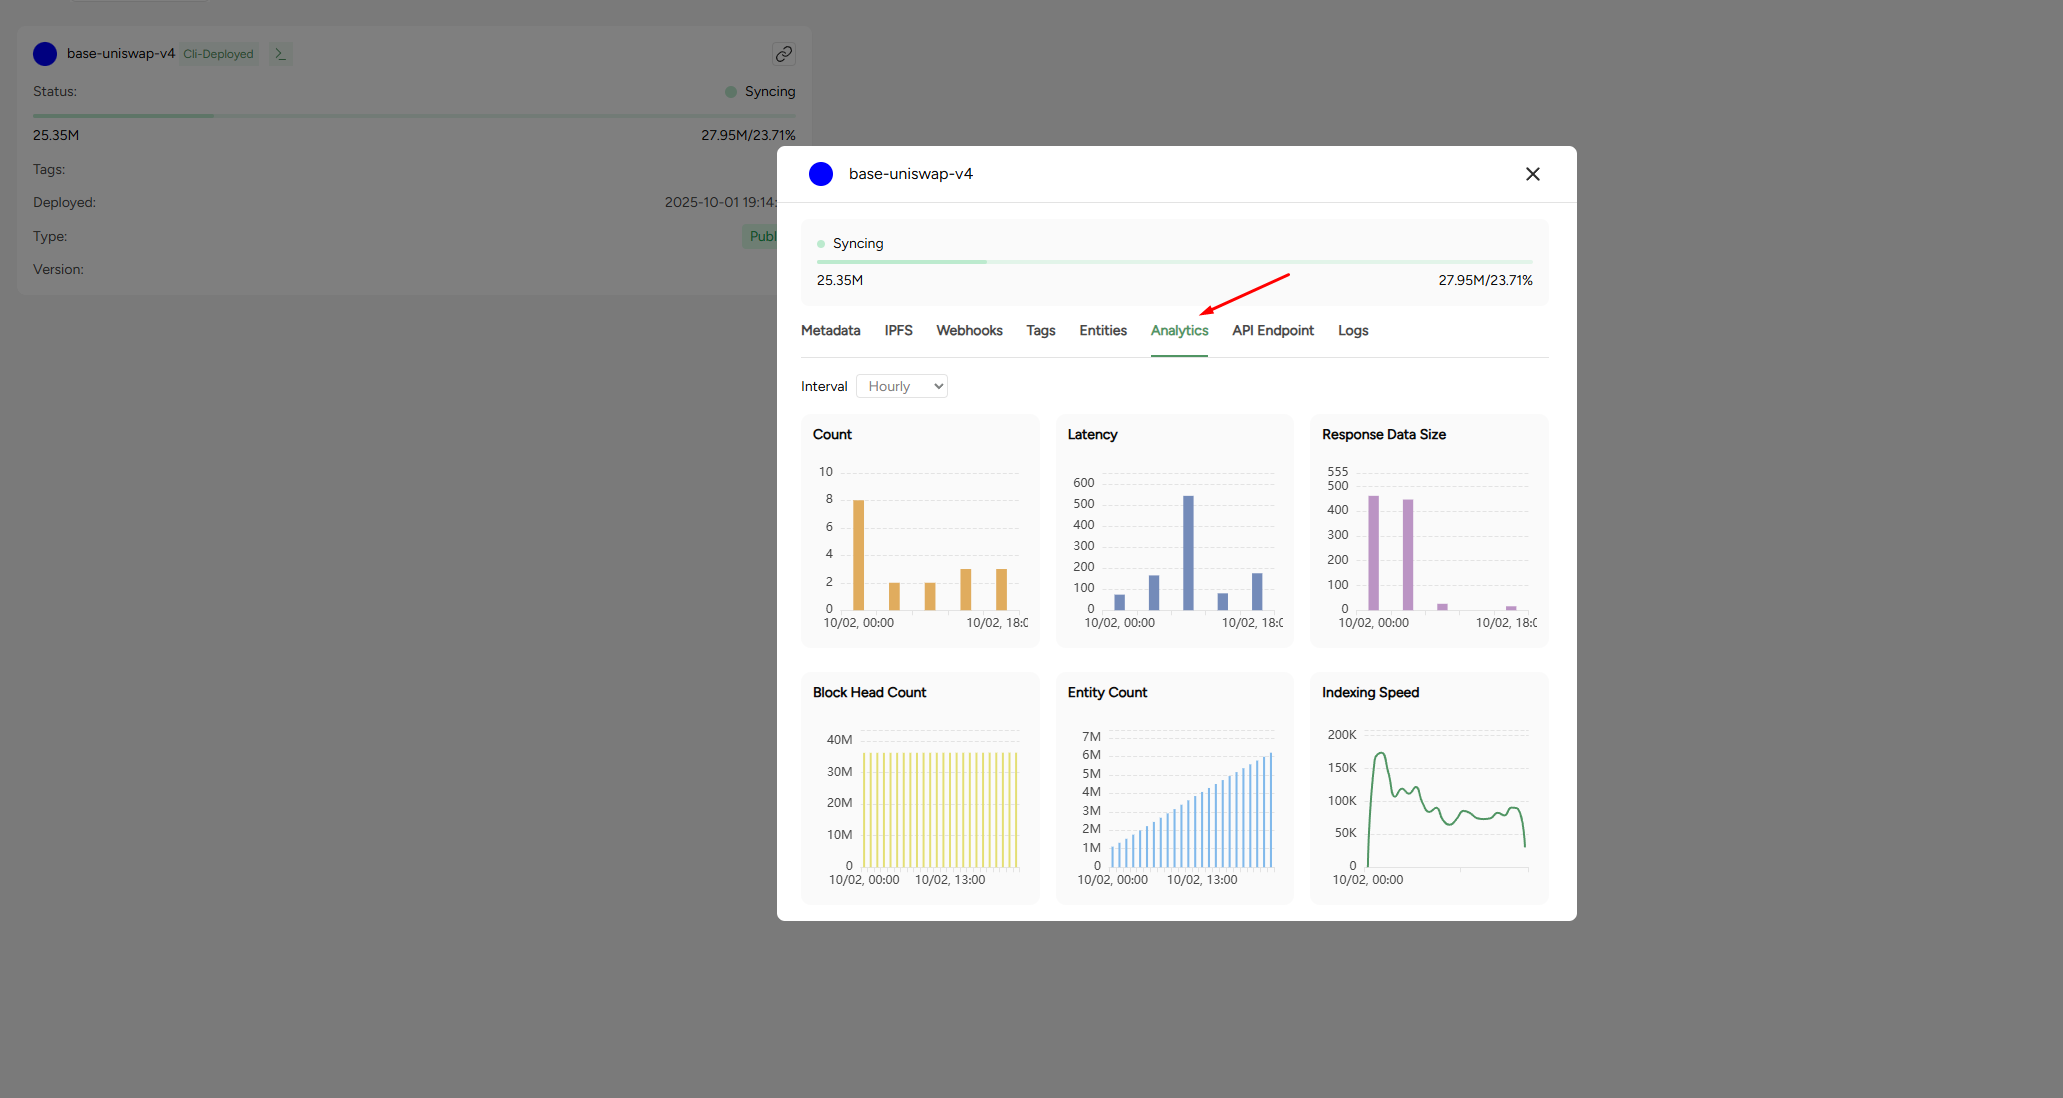
- Count - number of processed requests.
- Latency - Average response time in milliseconds.
- Response data size - Average size of responses returned.
- Block head count - The current block height the subgraph has synced to.
- Entity count - Total number of entities stored.
- Indexing speed - Rate of block / entity ingestion over time.
Monitoring logs
The logs provides a detailed runtime information for you subgraph. Logs are essential for debugging, monitoring performance, and identifying issues in your mappings or indexing process. You can filter logs by minimum log level and time range to narrow down what you’re looking for or use the search function to look up specific events, txn hashes, or handlers. Minimum log levels are defined as:Debug- Detailed technical logs for development and troubleshooting. Best for diagnosing specific issues in mappings or schema.Info- Standard operational logs showing normal indexing activity. Use to confirm your subgraph is progressing as expected.Warn- Alerts for unusual behavior that doesn’t stop syncing but may affect performance or data accuracy. Check the underlying log details to confirm if action is needed.Error- Critical issues that stop or block indexing. Always investigate the logs directly to identify the cause and resolve the failure.
Tips for monitoring
- Track syncing progress: Compare the subgraph’s block head with the chain’s latest block. Large gaps may indicate indexing lag.
- Watch for errors: Check logs regularly for failed handlers, out-of-gas errors, or schema mismatches.
- Monitor performance: Use latency and indexing speed metrics to anticipate scaling needs.